Debugging an evil Go runtime bug
Aug 28, 2018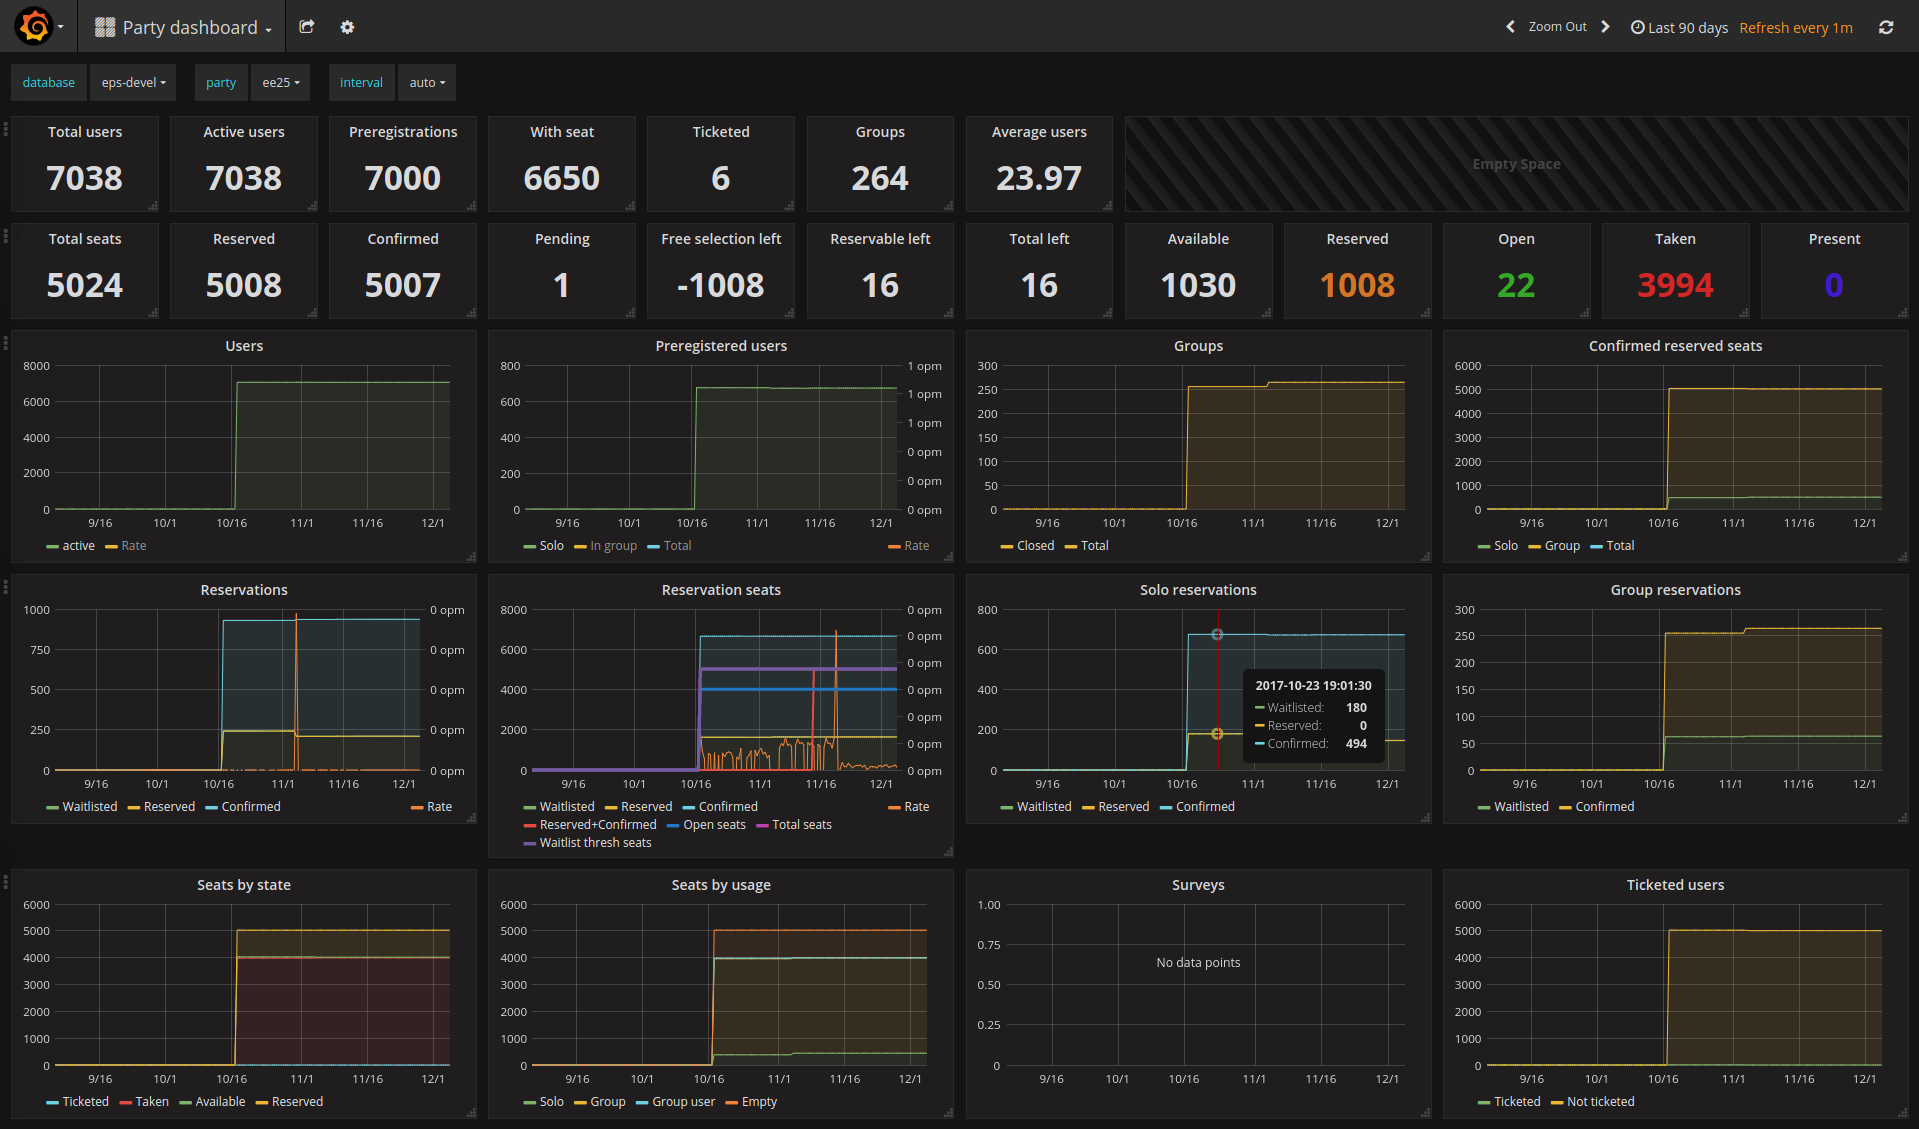
I’m a big fan of Prometheus and Grafana. As a former SRE at Google I’ve learned to appreciate good monitoring, and this combination has been a winner for me over the past year. I’m using them for monitoring my personal servers (both black-box and white-box monitoring), for the Euskal Encounter external and internal event infra, for work I do professionally for clients, and more.
Prometheus makes it very easy to write custom exporters to monitor your own data, and there’s a good chance you’ll find an exporter that already works for you out of the box. For example, we use sql_exporter to make a pretty dashboard of attendee metrics for the Encounter events. Since it’s so easy to throw node_exporter onto any random machine and have a Prometheus instance scrape it for basic system-level metrics (CPU, memory, network, disk, filesystem usage, etc), I figured, why not also monitor my laptop?
I have a Clevo “gaming” laptop that serves as my primary workstation, mostly pretending to be a desktop at home but also traveling with me to big events like the Chaos Communication Congress. Since I already have a VPN between it and one of my servers where I run Prometheus, I can just emerge prometheus-node_exporter, bring up the service, and point my Prometheus instance at it. This automatically configures alerts for it, which means my phone will make a loud noise whenever I open way too many Chrome tabs and run out of my 32GB of RAM.
Perfect.
Source: marcan.st